
A chart is a graphical representation of data in which “the data is represented by symbols, such as bars in a bar chart, lines in a line chart, or slices in a pie chart.” Putting up a chart or graph in your report or presentation will make sense of what you are saying. It helps user to understand data quickly.
In this tutorial we will see how to use google chart with PHP and MySQLi. Google chart library works only with data in JSON format. You can convert your database data into JSON format using PHP and then display data result into any type of chart, you can use Google Chart library that provides very powerful chart making tool that you can use for making chart very simple.
Google chart library is free and very easy to use. It allows you to customize your charts according to your need like increasing size of graphs and change of color and make your application more interactive.
LET’S DO IT!
Create table in MySQLi Database
CREATE TABLE `employees` (
  `id` int(11) NOT NULL AUTO_INCREMENT,
  `department` varchar(20) NOT NULL,
  `employees` int(11) NOT NULL,
  PRIMARY KEY (`id`)
) ENGINE=InnoDB AUTO_INCREMENT=6 DEFAULT CHARSET=latin1;
Insert Data into table
INSERT INTO `employees` VALUES ('1', 'HR', '10');
INSERT INTO `employees` VALUES ('2', 'Engineering', '30');
INSERT INTO `employees` VALUES ('3', 'Estimation', '25');
INSERT INTO `employees` VALUES ('4', 'Accounts', '7');
INSERT INTO `employees` VALUES ('5', 'IT', '9');
Database Connection
<?php
define('DB_SERVER', 'localhost');
define('DB_USERNAME', 'root');
define('DB_PASSWORD', '');
define('DB_DATABASE', 'googlechart');
$db = mysqli_connect(DB_SERVER,DB_USERNAME,DB_PASSWORD,DB_DATABASE);
?>
PHP Code to retrieve data from Database
<?php
$query = mysqli_query($db, "SELECT * FROM employees");
while($row = mysqli_fetch_array($query)){
echo $row['department'].", ". $row['employees'] ."<br>";
}
?>
The above code will retrieve date in the following format.

Now let’s change this result to be shown as a chart. For that we just need to add jQuery and Google Chart libraries in our code as below:
<script src="https://ajax.googleapis.com/ajax/libs/jquery/3.2.1/jquery.min.js"></script>
<script type="text/javascript" src="https://www.gstatic.com/charts/loader.js"></script>
After adding the above code in your <head> add the below code also to make a chart:
<script type="text/javascript">
// Load google charts
google.charts.load('current', {'packages':['corechart']});
google.charts.setOnLoadCallback(drawChart);
// Draw the chart and set the chart values
function drawChart() {
var data = google.visualization.arrayToDataTable([
['Department', 'No. of Employees'],
<?php
$query = mysqli_query($db, "SELECT * FROM employees");
while($row = mysqli_fetch_array($query)){
echo "['".$row['department']."',".$row['employees']."],";
}
?>
]);
// Optional; add a title and set the width and height of the chart
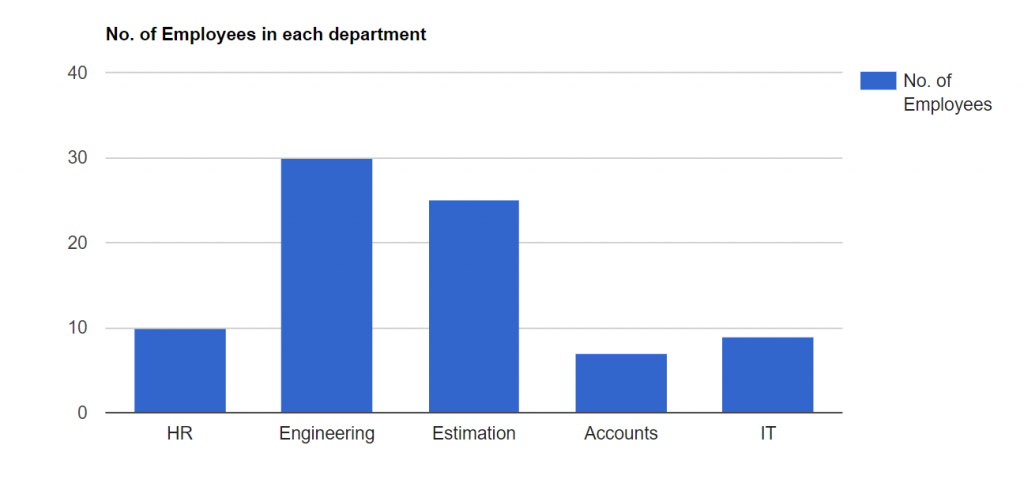
var options = {'title':'No. of Employees in each department', 'width':800, 'height':400};
// Display the chart inside the <div> element with id="ColumnChart"
var chart = new google.visualization.ColumnChart(document.getElementById('ColumnChart'));
chart.draw(data, options);
}
</script>
The End!
Wait a minute, I just forget to tell you there is one line of HTML code also in our script :-D. Just add below line of code in your <body> tag and that’s it.
<div id="ColumnChart"></div>
Now your chart will look like:
There are other types of charts also available in Google Chart. You just need to change the following line of code:
var chart = new google.visualization.ColumnChart(document.getElementById('ColumnChart'));
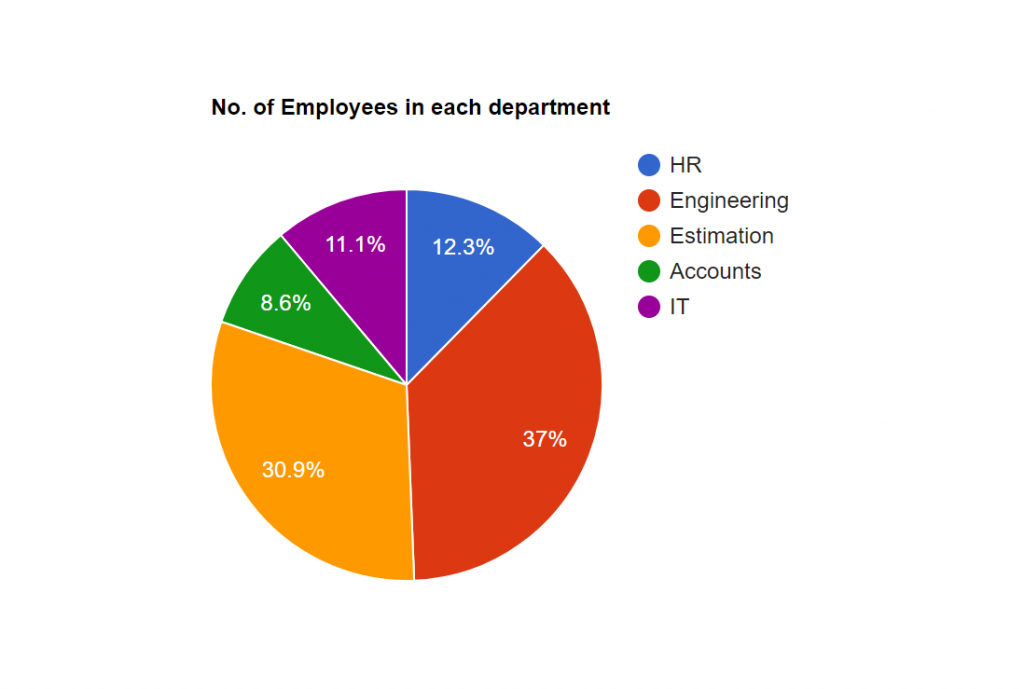
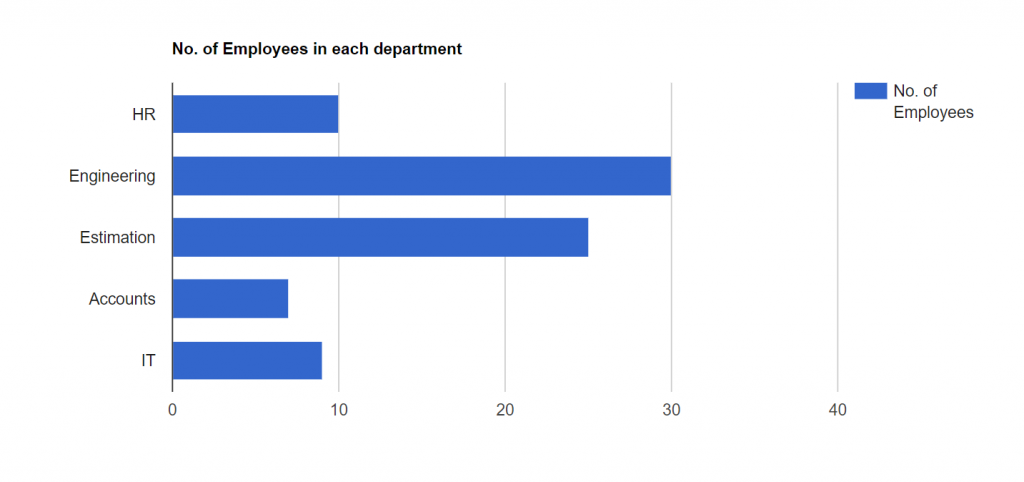
You can change ColumnChart() to PieChart() or BarChart(). For more Charts style you can visit Google Chart Page.
Pie Chart
Bar Chart


Ye ! This Is A Good Blog!